The OCR Job-Run Metrics That Matter
Table of contents (7)
- 11. Improving Chainlink Node Performance with Job Run Monitoring
- 1.1Issues That Can Be Resolved by Node Operators
- 1.2Issues That Node Operators Cannot Influence
- 22. Preventing Emerging Issues by Monitoring Pipeline Tasks
- 33. Achieving Faster Data Transfer by Monitoring Job Run Execution Time
- 44. Detecting Serious Outages by Monitoring the Amount of Job Runs
- 5Summary of Monitoring These 4 OCR Job Run Metrics
One of the most important aspects of operating a Chainlink node is monitoring its health, performance, and other key metrics to achieve the highest possible reputation and profit. This is made possible by setting up and maintaining an all-embracing monitoring system, which in our experience sets top node operators apart from very good ones in terms of performance optimization.
Every Chainlink node operator should be aware that selecting the metrics to monitor, creating appropriate queries and corresponding panels is a demanding task. The decisive factor is how well you can recognize problems that arise, identify their potential root causes and be able to fix them in the shortest possible time. In this article, we break down how Off-Chain Reporting (OCR) job run metrics can be leveraged to benchmark Chainlink node performance.
1. Improving Chainlink Node Performance with Job Run Monitoring
Since each job run in Data Feeds represents an OCR round observation that is shared with the other nodes of the DON, direct action is required in the event of job run errors.
Missed round observations negatively impact the reputation and profits of the affected Chainlink node operator as they are unable to provide data to the P2P network at this time.
By closely monitoring job runs, node operators can:
-
Detect and troubleshoot issues immediately
-
Maintain a high reputation score and avoid loss of profits
Ideally, job run errors should not occur, but in practice they cannot be avoided as there are various causes for them, some of which are beyond the control of node operators. These causes must therefore be analyzed and remedied through appropriate measures.
Issues That Can Be Resolved by Node Operators
The following causes can trigger job run errors and are within the responsibility of node operators. The root cause must be identified and eliminated to ensure continuous data provision.
-
Misconfiguration of the Chainlink node
-
Misconfiguration of an External Adapter
-
Misconfiguration of a bridge
-
Downtime or unresponsiveness of an External Adapter
-
External Adapter dependency issues (e.g. composite adapter, RPC endpoint)
-
Infrastructure network outage
Issues That Node Operators Cannot Influence
The following cases are beyond the control of Chainlink node operators but will result in job run errors. It is important to communicate them with the Chainlink team.
-
Data provider API incident (maintenance, outage)
-
Issue with the External Adapter image
-
Issue with the Chainlink node image
Job run errors caused by any of these reasons usually do not only occur with a single node operator. Therefore, early detection and communication with other node operators and the Chainlink team is essential. Long-lasting, unnoticed job run errors that are within your scope of origin and can therefore be corrected by the node operator themselves should be avoided at all costs.
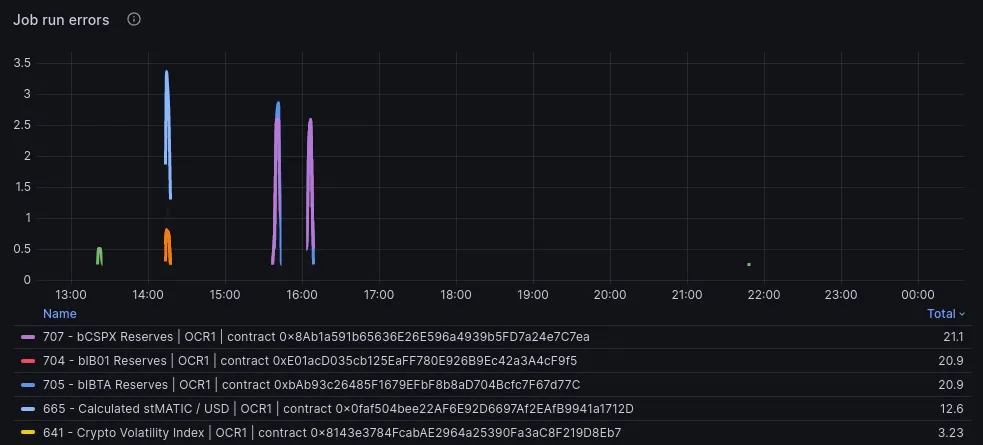
Grafana panel displaying occasional job run errors that arise from data provider API outages
2. Preventing Emerging Issues by Monitoring Pipeline Tasks
If you break down an OCR observation round one step further, you get to the individual tasks that must be carried out to complete a successful job run. In the example of a price feed, 3 predefined pipelines are executed one after the other, each containing several tasks. These are each responsible for querying the current value of a price pair from a data provider API and parsing the result into the correct format. As soon as the node has determined all 3 values, it can form the median from them and communicate its result to the rest of the DON.
It is important to monitor the Chainlink node for persistent task errors, although these do not necessarily result in a job run error, they can still impact performance and lead to serious problems, such as:
-
Deviation from the DON price median
-
Missed observations due to OCR round timeouts
The reasons for task errors can be exactly the same as for job run errors. It is therefore important to identify the behavior early, analyze it and find out the root cause. Occasional task errors can occur from time to time. These can be ignored if the following cases have been confirmed through communication with the Chainlink team and other node operators:
-
Forex/equity market close causing API errors
-
Data provider API maintenance
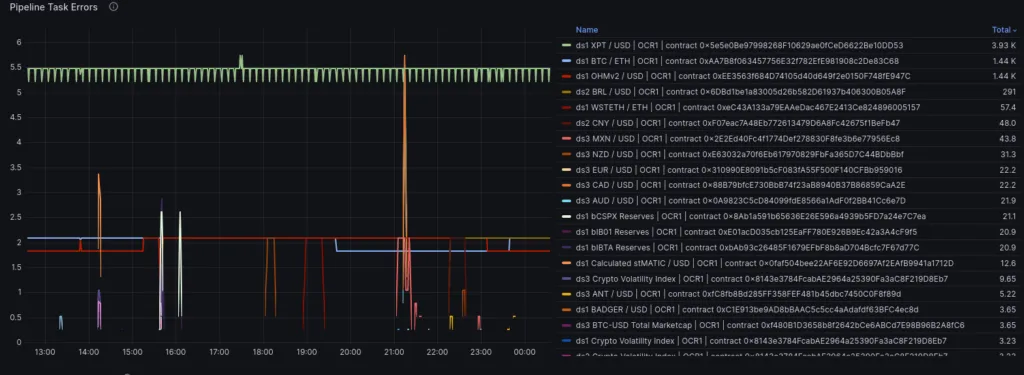
Grafana panel displaying constant pipeline task errors for certain ticker symbols
3. Achieving Faster Data Transfer by Monitoring Job Run Execution Time
Monitoring the execution time of Chainlink node job runs is critical. The execution time indicates how long it takes from the initiation of an off-chain data request to its potential transmission to a smart contract.
Accordingly, node operators should do everything they can to keep execution time as short as possible.
The following aspects can have an impact on job run execution time and should be taken into account if the monitoring system reports unusually long execution times.
-
Resource utilization of the Chainlink node host
-
Resource utilization of the External Adapter host
-
Infrastructure orchestration, network interaction between:
-
Chainlink node and database
-
Chainlink node and External Adapters
-
External Adapters and data provider APIs
-
External Adapters and RPC nodes
-
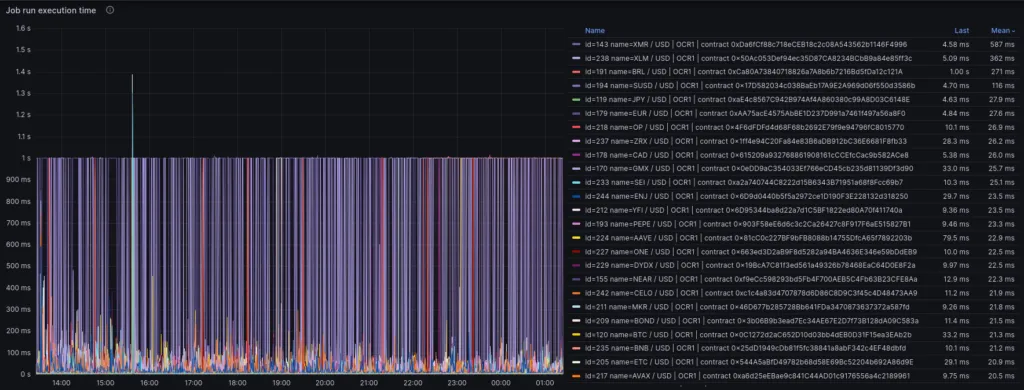
Grafana panel displaying job run execution time without constant timeouts. Most job runs take less than 200ms
4. Detecting Serious Outages by Monitoring the Amount of Job Runs
The number of runs of a single job is a useful metric for node performance for that particular data feed. The desired state is a constant number of runs per minute per job depending on its configuration. The number of all job runs (i.e. all supported feeds across a specific network) is a good indicator of the general health of the respective Chainlink node. An inconsistently decreasing number of job runs results in dropped OCR round observations, causing a Chainlink node to stop reporting data to the P2P network as intended. The potential root causes for this are diverse, which is why the behavior must be analyzed in order to be able to initiate troubleshooting measures as quickly as possible.
-
Network outage of hosting provider
-
Hardware/system overload
-
P2P connectivity issues (e.g. if another Chainlink node on this DON is unreachable)
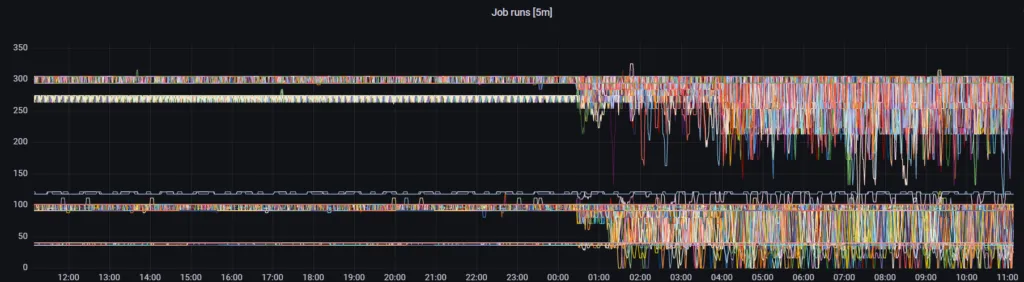
Grafana panel displaying a decreasing amount of job runs across multiple feeds
Summary of Monitoring These 4 OCR Job Run Metrics
These 4 job run metrics alone require a lot of time and expertise to be meaningfully visualized and interpreted. In addition, the corresponding alerts must be set up and fine-tuned so that you are not constantly notified of occasional errors or miss critical incidents. We will devote a separate blog post to this topic in the near future.
We would like to summarize the biggest advantages that come with a comprehensive monitoring system tailored to Chainlink node operations:
-
Maintaining node health and uptime
-
Boosting node performance
-
Optimizing resource utilization
-
Facilitating troubleshooting and debugging
-
Increasing reputation and profit
-
Resolving issues proactively and confidently
-
Gaining a competitive advantage
Do you monitor job run metrics in the same way? Stay tuned for more content related to Chainlink node monitoring and alerting.
Another area that is crucial for the performance of our nodes is the hosting provider and the hardware used. If you are interested, we recommend our blog post describing our migration from a major cloud platform to a bare metal environment.